Blue Team Toolkit: Wireshark, tcpdump, Suricata and Network hardening.
In cybersecurity a Blue team is what you would consider the “good guys”, people who focus on securing networks and infrastructures of the organization
they work for, and on defending against (and recovering from) cyberattacks.
In contrast to the Blue team, we have the Red team, which represents the people who practice ethical hacking and penetration testing. They essentially
test the defenses of any given system or of the overall security posture of an organization. There is also a Purple team (which as you might guess it's something in-between),
but in this post we're going to focus on Blue team operations and on defense.
More specifically we're going to focus on Network security, and three tools which are often used in this field: Wireshark, tcpdump and Suricata.
The first two offer similar functionalities and they're both Network Protocols Analyzers, also known as Packet Sniffers, while Suricata is an IDS/IPS
(more on this later). Another tool worth mentioning is TShark, it comes from Wireshark (the same team of developers, and it's still open-source),
and it's essentially the Unix-command line version of Wireshark.
I've tested these tools in my home lab and I'm going to explain how they're used and what they're capable of, while also providing some general advice
on network hardening and defense.
The role of a security analyst who works in a Blue Team also involves monitoring and analyzing network traffic flows.
One way to do this is by generating packet captures and then analyzing the captured traffic to identify unusual
activity on a network.
Packets going through the network contain a lot of information, and are divided into three mains parts:
1) Header (with various fields and information like what protocol, which source and dest IP etc.)
2) Payload (the actual data that's being transmitted)
3) Footer (not always present).
Packets can have several headers depending on the protocols used such as an Ethernet header, an IP header,
a TCP header, and more. With Packet Sniffers tools you can grab a snapshot of Packets that travel over
the network in the form of Packet Capture (Pcap), which is a file for containing data packets intercepted
from an interface or a network, and look for IoCs (indicators of compromise) -- that is, anything suspicious that
might suggest that someone is trying to breach the network or perform cyberattacks against it. Packet Sniffers can
also be used to simply monitor the network or for troubleshooting activities.

How does the Packet sniffing process start, then? The first step is to collect packets from the network via
the Network Interface Card (NIC), which is hardware that connects computers to a network.
NICs receive and transmit network traffic, but by default they only listen to network traffic that's addressed
to them. To capture all network traffic that is sent over the network, a NIC must be switched to a mode
that has access to all visible network data packets. In wireless interfaces this is often referred to as
monitoring mode, and in other systems it may be called promiscuous mode.
The Packet Sniffer then collects the network traffic in raw binary format (0s and 1s), which is converted
into a human-readable format. Pcap files can come in many formats depending on the packet capture library that's used.
Each format has different uses:
—Libpcap: is a packet capture library designed to be used by Unix-like systems, like Linux and MacOS.
Tools like tcpdump use Libpcap as the default packet capture file format.
—WinPcap: is an open-source packet capture library designed for devices running Windows operating systems. It's
considered an older file format and isn't predominantly used.
—Npcap: is a library designed by the port scanning tool Nmap that is commonly used in Windows operating systems.
—PCAPng: is a modern file format that can simultaneously capture packets and store data. Its ability
to do both explains the “ng,” which stands for “next generation.”
When using Packet Sniffers it's extremely important to filter data packets to find what you are
looking for, given that there are huge amounts of data going through the network at any given time.
Another important thing to note is that, when dealing with network traffic, a lot of the data is
represented by numerical values. To excel at network traffic and packet analysis, you must have a
good knowledge of protocol numbers (either decimal or hex representations).
The IANA (Internet Assigned Numbers Authority) organization assigns internet protocol numbers.
For example ICMP=1, IPv4=4, TCP=6, UDP=7 and so on, you can find
the full list here: protocol-numbers (IANA)
IANA is a standards organization that oversees global IP address allocation, autonomous system (AS)
number allocation, root zone management in the Domain Name System (DNS), and much more.
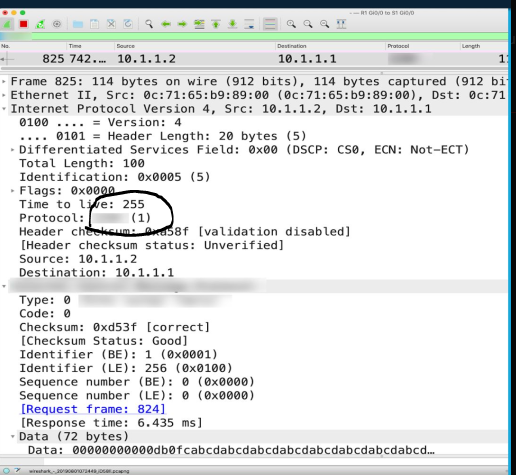
Here's an example of an ICMP packet, as seen from the Wireshark details screen. You should notice
that the assigned number is (1), which indicates the ICMP protocol.
Wireshark

Wireshark is one of the most used Network Protocols and Packets Analyzer tools out there. It is open-source,
cross-platform and has a GUI (Graphical User Interface), unlike tcpdump which is command line based.
There are multiple purposes for Wireshark:
—Detecting and troubleshooting network problems, such as network congestion.
Keep in mind however that Wireshark is not an Intrusion Detection System (IDS) or IPS (Intrusion Prevention System),
like Suricata, which means it can only read packets and perform extensive investigations, but it can't act on them.
—Detecting security anomalies like suspicious traffic or rogue devices/hosts.
—Investigating and learning protocol details.
—Establishing a baseline for network traffic patterns and network utilization metrics. (this one, like the other features, are not
exclusive to Wireshark)
The GUI has a few different components, see below for an explanation and screenshot.
Toolbar: it contains multiple menus and shortcuts for packet sniffing, including filtering, sorting, summarizing,
exporting and merging.
Display Filter Bar: the main section to perform querying and filtering.
Recent Files: a list of the recently investigated files.
Capture Filter and Interfaces: filters for captures and the available network interfaces.
Status Bar: Tool status, profile and numeric packet information.
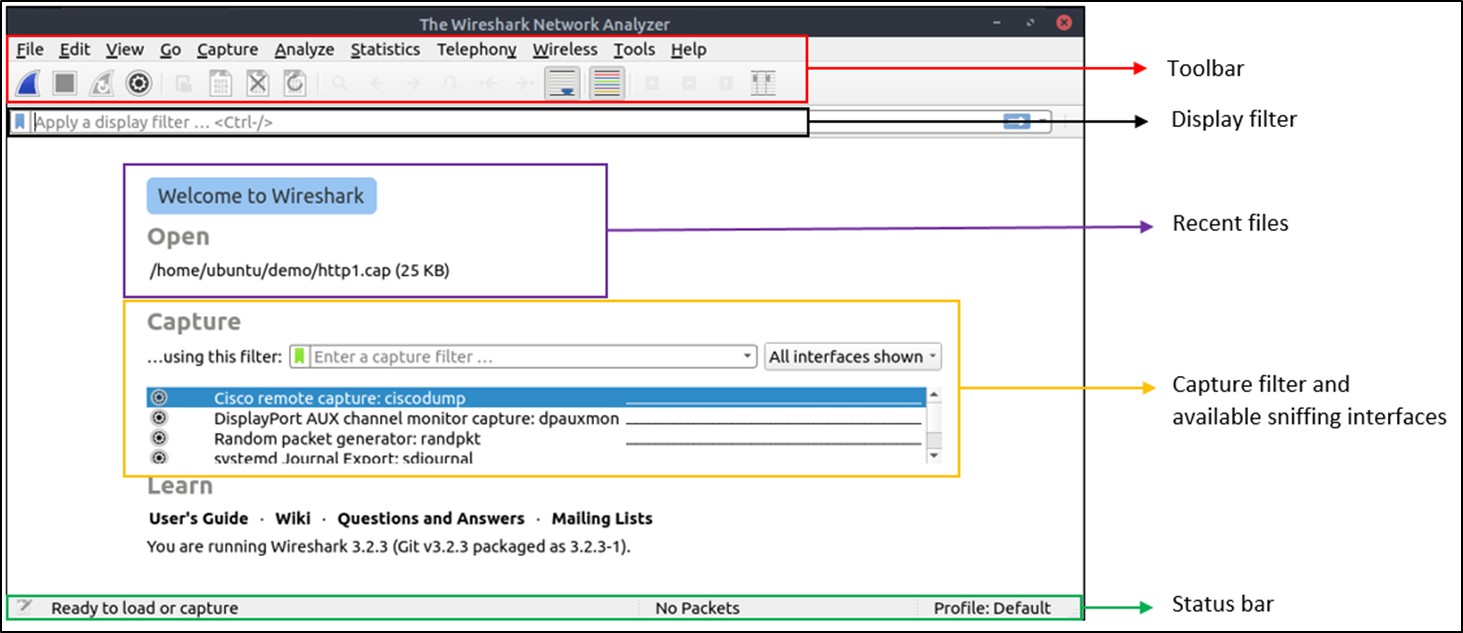
The above is a screen with Wireshark empty interface, and here below is a screen after opening a
pcap file:
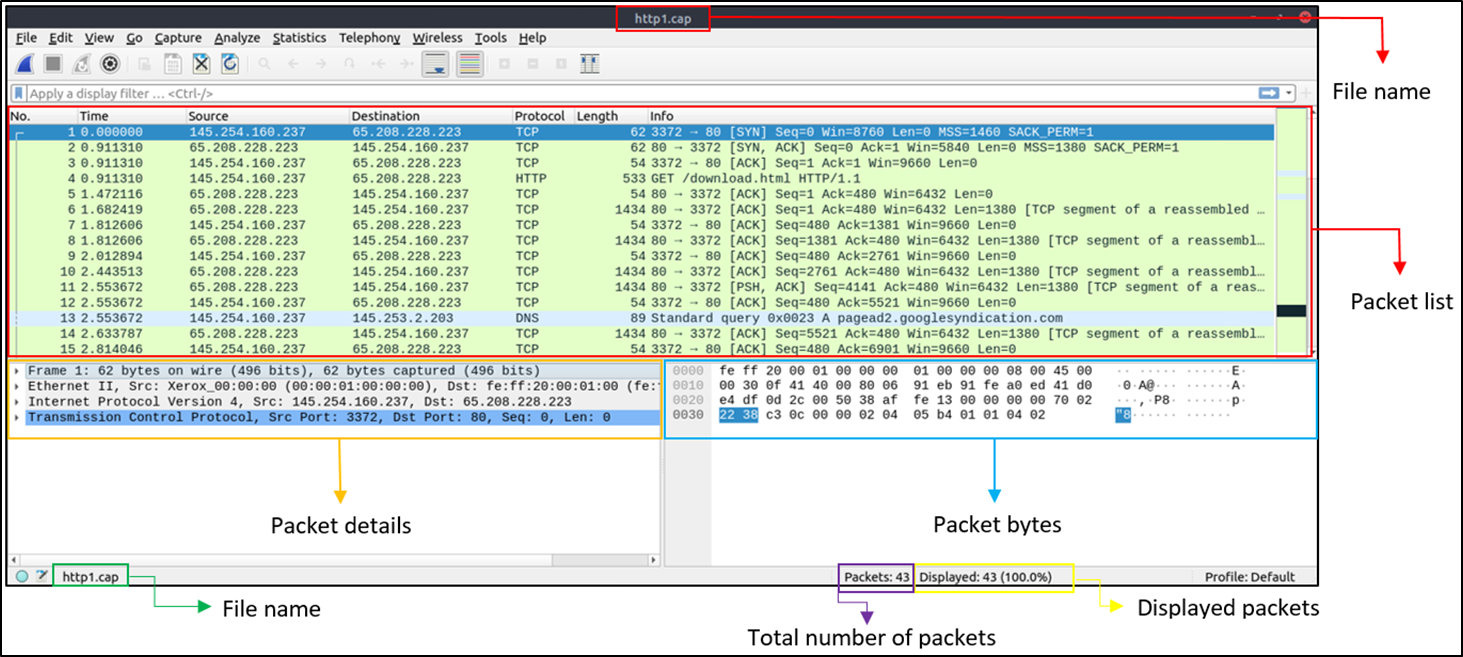
A few important panels to take notice of are the Packet Details Panel, which shows detailed
protocol breakdown of the selected packet, and the Packet Bytes Panel, showing Hex and decoded
ASCII representation of the selected packet.
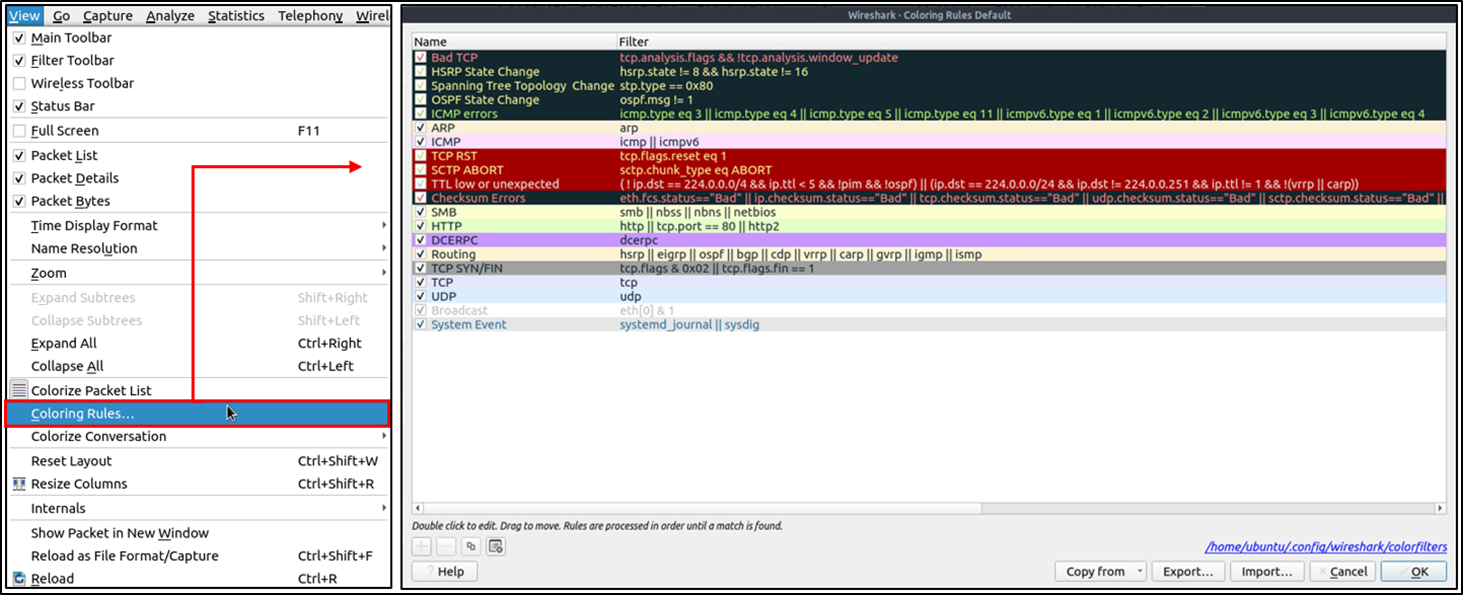
You might also notice that there are different colors representing different protocols and packets.
Wireshark, along with quick packet information, also colors packets according to different conditions and protocols,
to spot anomalies more quickly. You can go to the "View > Coloring Rules" menu to create permanent coloring rules.
If you want to start “sniffing”, that is, capturing packets, you can click on the “shark blue button” at the top,
likewise you can stop the packet capture by clicking on the red button afterwards.
Wireshark can also merge two pcap files into one file. You can use the "File > Merge" menu to merge a pcap
with the one you have open, Wireshark will also show the combined total of packets after selecting the second
file and merging.
We'll now look at what is known as Packet dissection. It's essentially a “protocol dissection”, Wireshark
decodes available protocols and fields of any select packet, and you can inspect all those details
in the specific panels, as seen below. Wireshark supports a lot of protocols for dissection, and you can even
write your own dissection scripts.
Packets can consist of 5 to 7 layers based on the OSI model, take a look at the following screens and the packet details:
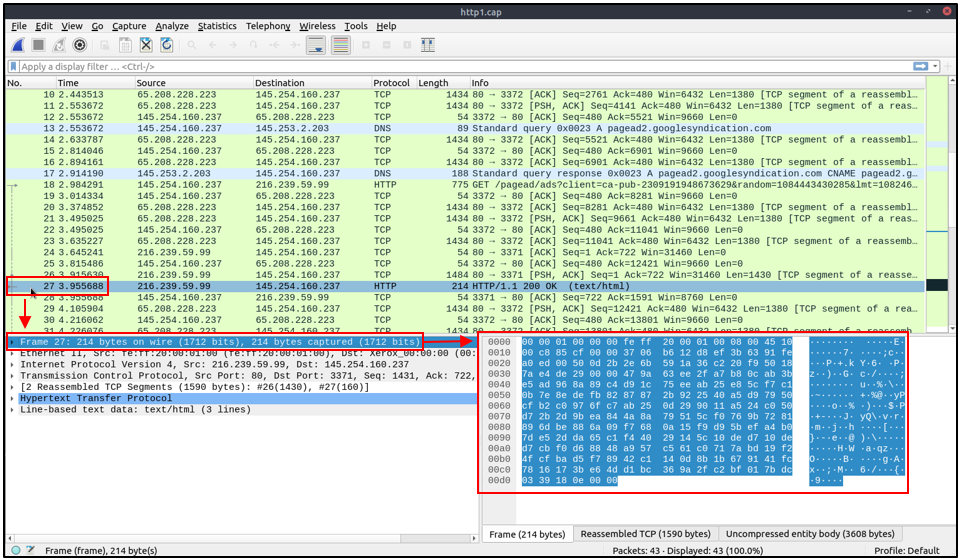
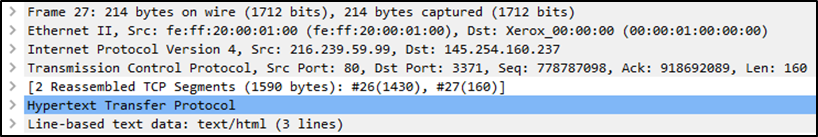
*note: the 27 in “Frame 27” means that we're inspecting the 27th packet.
We can see seven distinct fields to the packet: frame/packet (Physical layer / layer 1), Ethernet II with MAC addresses (Data Link layer / layer 2),
Internet Protocol (layer 3), TCP (in this case) protocol (layer 4), protocol errors (continuation of layer 4),
application protocol (layer 5, it shows details specific to the protocol used, such as HTTP, FTP etc),
and application-specific data (extension of a layer 5).
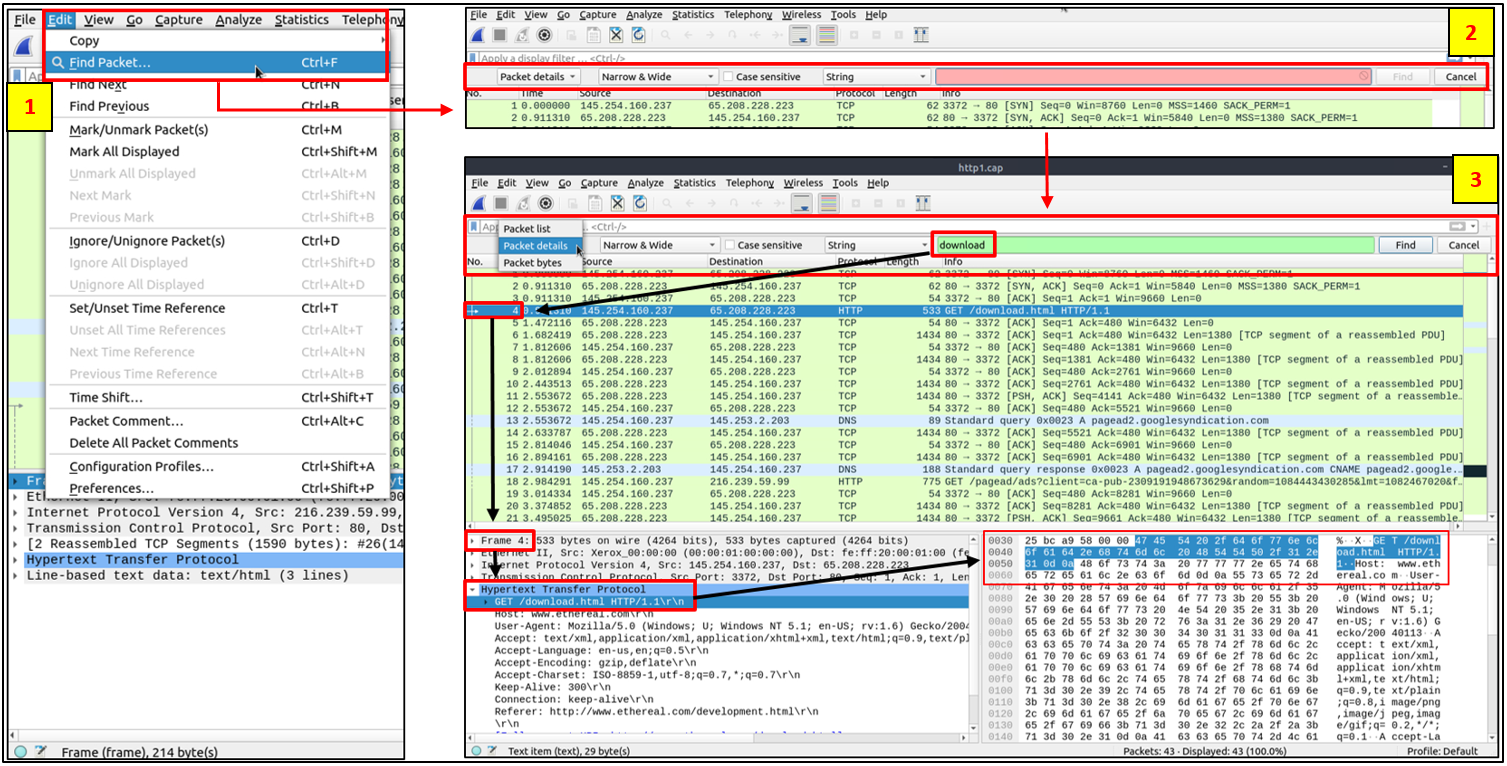
Among many different features, such as Marking packets, writing comments or exporting packets or objects (files),
Wireshark can also find packets by packet content. You can use the "Edit > Find Packet" menu to make a search inside
the packets. This helps security analysts to find specific intrusion patterns or failure traces.
Take a look at the image below for a simple example:
As mentioned before, packet filtering is extremely useful when working on Network Traffic data and when using Packet Sniffers.
Wireshark has a powerful filter engine with two types of filtering approaches: capture and display filters.
Capture filters are used for "capturing" only the packets valid for the used filter, whereas display filters are used
for "viewing" the packets filtered. In Wireshark you can filter by using queries, but also by using the GUI and its interface. Both are valid options
and it depends on what you want to achieve.
The most basic way of filtering traffic is by using the GUI and the “Analyze” tab at the top, which contains many options.
You can click on the field you want to filter and use the
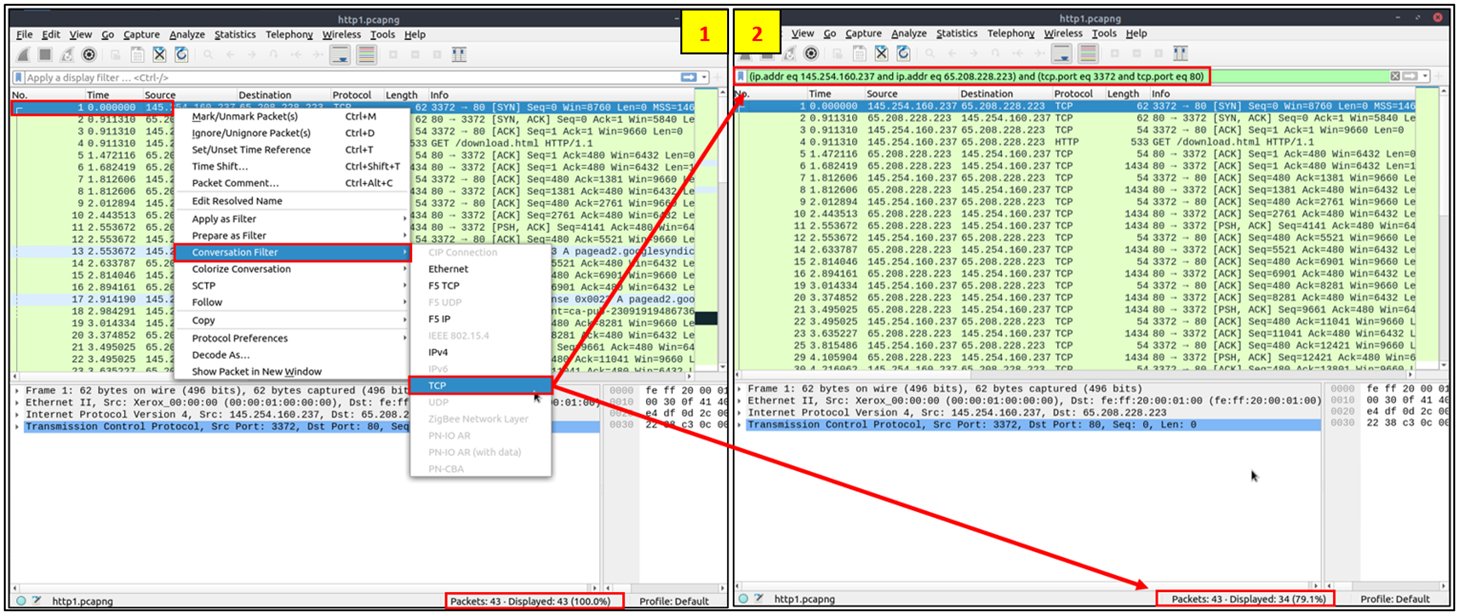
"right-click menu" or "Analyze > Apply as Filter" menu to filter the specific value. Once you apply the filter,
Wireshark will generate the required filter query, apply it and show the results. One of the many useful options
you can select is also the "Conversation Filter", this option helps you view only the related packets
to what you selected and hides the rest of the packets.
Essentially you can filter to find out all the packets that “converse” with another specific packet. You can also use the
"right-click menu" or "Analyze > Conversation Filter" menu to filter conversations, as seen in the screen below:
Lastly, it's also useful to write queries in the filter bar at the top, and perform searches with those. For writing
queries you can use different operators, such as the “contains operators”, which are used to filter packets that contain
an exact match of a string of text. One example would be typing: [http contains “moved”], to find packets containing
exactly that string.
You can also use the “matches operators” , to filter packets based on the regular expression (regex) that's specified
(regular expression is a sequence of characters that forms a pattern), and “comparison operators”, using the == equal (or “eq”)
symbol, for example: ip.src == 8.8.8.8 or ip.src eq 8.8.8.8, along with other symbols like the != (ne, not equal) etc.
You can also combine comparison operators with Boolean logical operators such as [and] and [or], to create complex display filters.
It's also very important to write queries to filter for protocols and ports, and to do this you can simply enter the name of the protocol to filter,
or using the (==) equal operator followed by the port number. For example udp.port == 53 or tcp.port == 25.
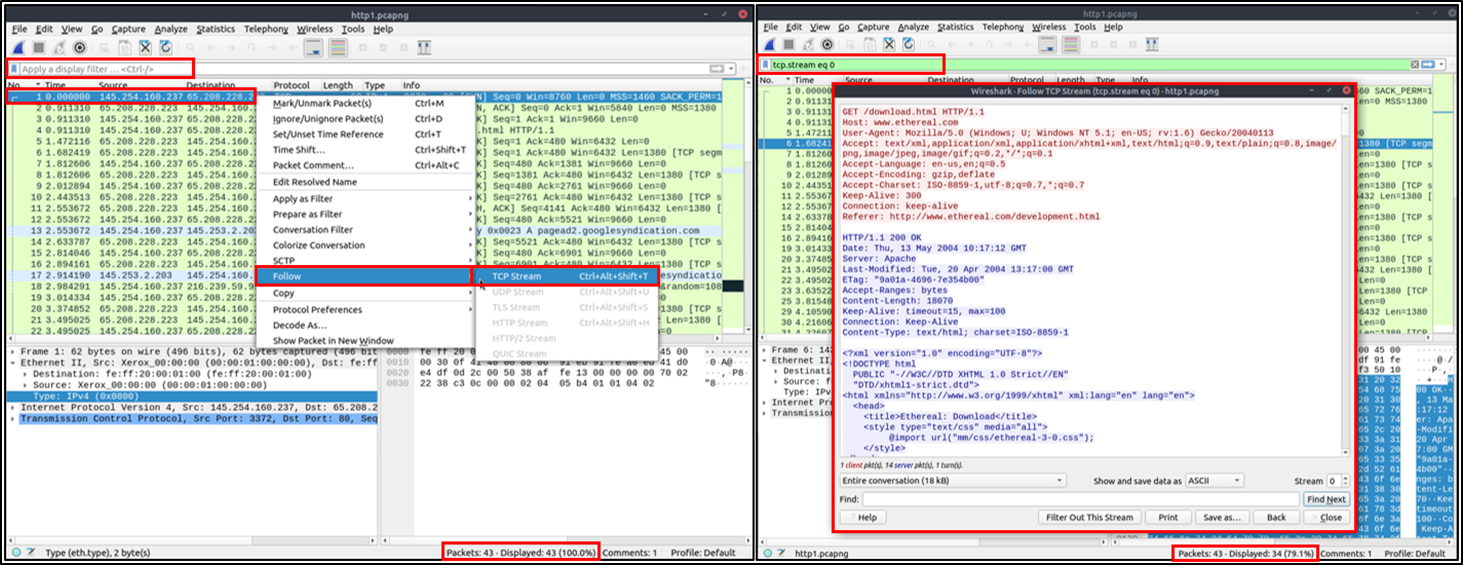
Another important feature of Wireshark is the ability to Follow Streams of Network Traffic, that is viewing the raw
traffic as it is presented at the application level. This helps security analysts recreate the application-level data,
and it's even possible to view the unencrypted protocol data like usernames, passwords and more. We can do
this by using the"right-click menu" or clicking on "Analyze > Follow TCP/UDP/HTTP Stream" to follow traffic streams.
tcpdump

Tcpdump is a command-line network protocol analyzer. It is lightweight and uses the open-source libpcap library.
Tcpdump is text based, meaning all commands in tcpdump are executed in the terminal. It can also be installed on
other Unix-based operating systems, such as macOS.
It converts key information about network traffic into formats easily read by humans. It prints information about
each packet directly into your terminal.
A thing to note is that by default, tcpdump will attempt to resolve host addresses to hostnames. It'll also replace
port numbers with commonly associated services that use these ports.
Here's a simple diagram showing a few similarities and differences between tcpdump and Wireshark:
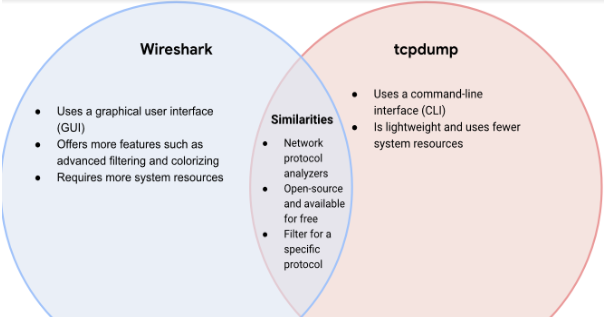
Essentially, compared to Wireshark tcpdump is more lightweight (requires less system resources) and can be quickly used with the
command line, however it has less overall features.
Printed information about the network traffic and packets is printed directly into the terminal while using tcpdump,
and this information has a specific formatting and different fields. Let's see an example:
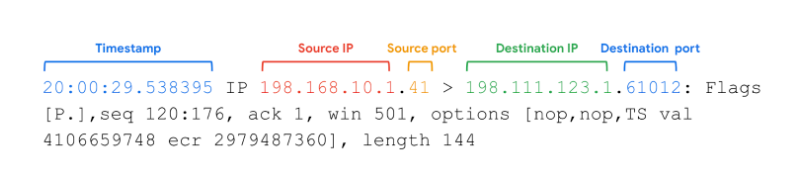
(timestamp is in hours:minutes:seconds and microseconds)
Worth nothing here are the flags and the other options, as the rest is quite self-explanatory. Flags are important
because they tell us useful information about the packet and traffic of the network, like TCP Flags which indicate a
particular state within the conversation, for example they could be SYN Packets that are used to initiate a connection.
You'll see TCP flags as something like: [S] - Connection Start , or [F] - Connection Finish, or [.] - Acknowledgment (ACK).
You can even have combinations like [S.] for a SYN-ACK packet.
Other parameters you could find are: "Window size (win)", which represents the number of bytes available in the receiving buffer,
followed by TCP options such as the MSS (Maximum Segment Size) or Window Scale. Also the packet length, "length 144",
which represents the length, in bytes, of the payload data.
Filtering for specific packets you're looking for is one of the main features of tcpdump, and it offers many ways of doing it,
using a variety of parameters, such as source and destination IP addresses, ports, protocols, and so on.
Here's a list of a few useful commands for filtering:
(Keep in mind that for the following commands to work, you most like have to type in “sudo” before them, so that you can
execute them as root/”superuser”)
1) perform a simple capture: $sudo tcpdump -i any -c5 -nn
-i = indicates the network interface to capture traffic from (in this case, any / all of them).
-c5 = indicates 5 captures.
-nn = disable name and ports resolution (saves time since tcpdump doesn't do dns lookup, especially useful when
troubleshooting).
2) filter packets based on protocol (simply specify the protocol in the command line):
tcpdump -i any -c5 icmp (for ICMP protocol)
3) filter with the host name (ip or actual name): tcpdump -i any -c5 -nn host 54.204.39.132
4) filter with the port: tcpdump -i any -c5 -nn port 80
5) filter with source ip/hostname or destination ip: tcpdump -i any -c5 -nn src/dst 192.168.122.98
You can also combine filters by using the logical operators [and] and [or], to create more complex expressions.
For example to filter packets from source IP address 192.168.122.98 and service HTTP you can do:
tcpdump -i any -c5 -nn src 192.168.122.98 and port 80
Also, if we need to inspect the content of the packet to ensure that the message we're sending contains what we need,
we can add the option -X to print in hex and ASCII, or -A to print the content in ASCII.
6) save packets to a file instead of displaying them on screen, with the option -w (for write):
tcpdump -i any -c10 -nn -w webserver.pcap port 80
This command saves the output in a file named webserver.pcap. Nothing gets displayed on screen since the packets
are being saved in the file (if you use the option -v you can still see the output on the terminal).
It's also worth mentioning that tcpdump creates a file in binary format so you cannot simply open it with a
text editor. To read the contents of the file, execute tcpdump with the -r (for read) option:
tcpdump -nn -r webserver.pcap
Here's also two examples of commands using filtering operators and a few different options, to display HTTP traffic:


While tcpdump might not have all the features of Wireshark, it's still an extremely powerful and useful tool that should be part of your Blue team operations toolkit.
Suricata

Suricata is a high performance, open source network analysis and threat detection software used by many
organizations around the globe. Suricata is developed by the Open Information Security Foundation (OISF)
and its supporting vendors.
Suricata is an incredible tool which has many features on top of being an IDS-IPS. I won't cover all of
its features, I will simply give a general overview of Suricata and why it's another very important
tool for any Blue Team operation.
As mentioned, Suricata can be both an IDS and IPS. IDS stands for Intrusion Detection System, these systems often sniff data
packets as they move across the network and analyze them for the characteristics of known attacks. Some IDS systems
review not only for signatures of known attacks, but also for anomalies that could be the sign of malicious activity.
The limitations to IDS systems are that they can only scan for known attacks or obvious anomalies, so new and sophisticated
attacks might not be caught. Also IDS doesn't actually stop the incoming traffic if it detects something suspicious.
It's up to the security analysts to take action on it. Lastly, the IDS is placed behind the firewall and before entering
the LAN, this is done to reduce noise in IDS alerts, also referred to as false positives.
On the other hand, IPS stands for Intrusion Prevention System. IPS systems are applications that monitor system activity
for possible intrusions and take action to stop them. It offers even more protection than an IDS because it actively
stops anomalies when they are detected. An IPS reports the anomaly to security analysts and blocks a specific sender
or drops network packets that seem suspect.
One potential limitation however is that it is inline: if it breaks, the connection between the private network and
the internet breaks. Another limitation of IPS is the possibility of false positives, which can result in legitimate
traffic getting dropped.
Essentially, there are three main ways Suricata can be used:
1) As an Intrusion detection system (IDS): as a network-based IDS, Suricata can monitor network traffic and alert on
suspicious activities and intrusions.
2) As an Intrusion prevention system (IPS): running Suricata in IPS mode requires additional configuration such as enabling
its IPS mode.
3) For network security monitoring (NSM): in this mode, Suricata helps keep networks safe by producing and saving relevant network logs.
Suricata can analyze live network traffic, existing packet capture files, and create and save full or conditional packet captures.
It's worth noting that Suricata also has two different log formats:
a) EVE JSON, which stands for Extensible Event Format JSON: contains detailed info about logs and alerts generated by Suricata.
b) fast.log: used to record minimal alert information and is considered a legacy file format and is not suitable for incident
response or threat hunting tasks.
And it generates two different types of log data:
a) Alert logs: it's information related to security investigations and security alerts. It shows the output of signatures
that triggered the alert.
b) Network Telemetry logs: they contain information about network traffic flows, it's not always security relevant,
it's simply reporting what's happening on the network.
When working with Suricata you'll also be managing the Configuration files, which let you customize exactly how you want the
IDS-IPS functionalities to interact with the rest of the environment. Suricata's configuration file is suricata.yaml,
which uses the YAML file format for syntax and structure. In such a file you could find variables such as $HOME_NET,
a Suricata variable that you can use in your rule definitions as a placeholder for your local or home network, to identify
traffic that connects to or from systems within your organization. An $EXTERNAL_NET variable is also defined by default.
In the suricata.yaml configuration file you can also specify whether to run Suricata in IDS or IPS mode (it's IDS by default). To do this
simply edit the file and remove the “#” from either “#LISTENMODE=af-packets #IDS” or “#LISTENMODE=nfqueue #IPS”, the latter for the IPS mode. The “#” sign
turns those lines into comments (so they get ignored), by removing it you “activate” those specific actions.
Many NIDS (Network-based IDS) come with pre-written signatures (or rules), almost like customizable templates. These
templates in Suricata are present in the rules folder with the .rules extension, for example a file called “custom.rules”.
Here's an example:
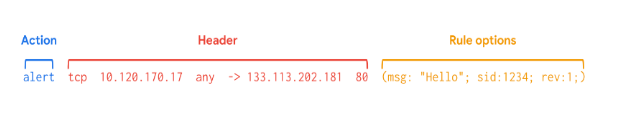
Rules and their correct configuration is an extremely important aspect of managing tools like Suricata. They dictate what you want them to do and how to behave.
As seen in the image above we have three different sections from which the rule is created:
1) First section is the Action. Actions in Suricata indicate (as you might expect) what's gonna happen if the condition is met;
the most common ones are: alert, drop, pass, and reject.
ーAlert action = generates an alert if the criteria is met.
ーDrop action = also generates an alert, but it drops the traffic. A drop action only occurs when Suricata runs in IPS mode.
ーReject action = does not allow the traffic to pass. Instead, a TCP reset packet will be sent, and suricata will drop the matching packet.
ーPass action = allows the traffic to pass through the network interface. The pass rule can be used to override other rules.
2) Second section is the Header, it specifies various information such as the Protocol, which can be either one as TCP or UDP or a specific
one such as HTTP, DNS, FTP etc. For each protocol, there are specific keywords that can be used in the packet's signature.
In the Header the Source IP and port also get specified, along with the Destination IP and port. This traffic flow can only be
either from source to destination (represented by ->) or bidirectional, you cannot set rules from destination to source.
3) Last section is the Rule options, which specify what the packet's state description should be as the rule gets triggered.
It starts with ( and ends with ), continues with a list of keywords that are delimited by ; . Rule options in Suricata have a
specific ordering and changing their order would change the rule. For this section there are many different options that you could
specify.
Two important keywords in the Rule options section are sid and rev. Every Suricata signature needs a unique Signature ID (sid).
If two rules have the same sid, Suricata will not start and will instead generate an error. Suricata's built-in rules are
in the range from 2200000-2299999, whereas the range 1000000-1999999 is reserved for custom rules.
Along with a sid, the rev option is used to specify the version of a rule. If there have been multiple versions of a
signature with changes over time, that would be noted and specified with “rev”.
It's also worth mentioning a few useful and common options you can utilize when running Suricata from the command line:
-i [interface] = after the -i option you can enter the interface card you would like to use to sniff packets from. This option
will try to use the best capture method available.
-r [sample.pcap] = after the -r option you can enter the path to the pcap file in which packets are recorded. This way you can
inspect the packets in that file in the pcap/offline mode.
-l [directory] = with the -l option you can set the default log directory that will be used by Suricata. If you do not set
a directory with the -l option, Suricata will use the directory that is set in yaml configuration.
-S [custom.rules] = instructs Suricata to use the rules defined in the custom.rules file.
-k [none] == instructs Suricata to disable all checksum checks.
-h, which is essentially the “help” page (present in almost every tool), it's a great way to either learn new commands
or refresh your memory if you forget the correct syntax of whatever it is you need to do. It's also faster, but
obviously less detailed, than checking the Suricata documentation.
This was just a general overview of Suricata, which has quite a lot of capabilities and it's undoubtedly a
powerful tool for any security analyst.
Network and Cloud Hardening
Network hardening is the process of reducing security gaps and vulnerabilities, while strengthening the defenses of a
given network. Network hardening standards and best practices help guide this process. It will help your networks
reduce the vulnerabilities malicious actors could exploit while optimizing your security posture. It is a process
that every security analyst should be aware of, and that every security team needs to act on.

Network Hardening actions can be either done only once, or regularly. Regularly performed network hardening actions should
be things like: Network log analysis, Firewall Rules maintenance, patch updates and server backups. Network log analysis,
specifically, can be done with a SIEM (Security Information Event Management) tool, like Splunk or Google Chronicle.
Tasks that can be done once are things like: Port filtering on firewalls, Network Access privileges and Encryption.
Port filtering is a firewall function to allow or block certain port numbers. Only ports that are needed are the ones
allowed, as a basic principle. For Network Access privileges, you should thoroughly check who has access to what, and make
sure the access that's been granted it's actually needed (if not, revoke that access). You should also use Network
Segmentation to create different isolated environments or subnets: isolating zones has many benefits, such as blocking
the spread of malware from an infected machine to the rest of the network. You should also only use the most
up-to-date wireless protocols. Lastly, make sure to encrypt all your data with the latest encryption standards.
Among other many good practices for Network Hardening, also consider the following practices:
- Password policies: the National Institute of Standards and Technology's (NIST) latest recommendations for password policies
focuses on using methods to salt and hash passwords, rather than requiring overly complex passwords or enforcing
frequent changes to passwords. Password policies are used to prevent attackers from easily guessing user passwords,
either manually or by using scripts (commonly called a brute force attack).
- Multi Factor Authentication (MFA): a security measure which requires a user to verify their identity in two or more ways
to access a system or network. MFA options include a password, pin number, badge, one-time password (OTP) sent to a
cell phone, fingerprint, and more. Can help protect against brute force attacks and similar security events.
- Disabling unused ports: ports can be blocked on firewalls, routers, servers, and more to prevent potentially dangerous
network traffic from passing through. Before an incident occurs, disabling unused open ports can help prevent malicious
actors from entering the network.
- Hardware & software disposal: it ensures that all old hardware is properly wiped of all data and disposed of.
Prevents the network from various threats by removing outdated or unused software or hardware that do not have the latest
security patches or updates.
- Penetration test (pen test): a simulated attack that helps identify vulnerabilities in systems, networks, websites,
applications, and processes. Pen tests are used to protect and prevent potential cyber attacks.
All these processes could be considered part of a concept called Layered security. Each tool used to secure the network
is an additional layer of defense that can incrementally harden a network, starting with the minimum level of security
(provided for example by just a firewall), to a much higher level of security achieved by combining many different tools.
It's generally recommended that security teams utilize all the tools discussed in this post (Packet sniffers and IDS-IPSes),
plus additional tools like SIEMs, SOARs and EDRs, to maintain a good security posture.
Cloud Network Hardening
As more and more organizations move to the Cloud, new security challenges arise. A lot of the security is provided by the
CSP (cloud service provider), however you still have to manage and configure many things. For example, one difference
with Cloud network hardening vs standard network hardening is the use of a Server baseline image for all server instances
stored in the cloud. This allows you to compare data in the cloud servers to the baseline image, to make sure no
changes/alterations have been made.
In the cloud, a commonly accepted security principle is the shared responsibility model. The shared responsibility model
states that the CSP must take responsibility for security involving the cloud infrastructure, including physical
data centers, hypervisors, and host operating systems. The company using the cloud service is responsible for
the assets and processes that they store or operate in the cloud. The extent of this and its scope however change
based on which service you're using, whether it's a SaaS, IaaS or PaaS makes a significant difference.
Some common cloud security hardening techniques include: incorporating IAM, hypervisors management, baselining,
cryptography and cryptographic erasure.
Checking Configurations to make sure they're set right is also very important: if the services moved to the
cloud are not properly configured, they could leave the network open to compromise. A source of cloud security
issues is often misconfigured cloud services, and given the vast amount of services in the cloud, the Attack Surface
is also potentially bigger, if all the security options aren't properly configured.
Another thing to make sure is properly configured is IAM. Identity access management (IAM) is a collection of
processes and technologies that helps organizations manage digital identities in their environment. A common problem
that organizations face when using the cloud is the loose configuration of cloud user roles, which increases risk
by potentially allowing unauthorized users to have access to critical cloud operations.
As for managing hypervisors, one thing to note is that there are two types of hypervisors. Type one hypervisors
run on the hardware of the host computer, like for example VMware's EXSi. Type two hypervisors operate on
the software of the host computer, like for example VirtualBox. Cloud service providers (CSPs) commonly
use type one hypervisors.
One more important aspect of Cloud Security is Cryptography, which can be applied to secure data that is processed
and stored in a cloud environment. Modern encryption relies on the secrecy of a key, rather than the secrecy of an
algorithm, and for this reason Key Management is extremely important.
You should also make use of Cryptographic erasure or Crypto-shredding, which is a method of erasing the encryption
key for the encrypted data. When destroying data in the cloud, more traditional methods of data destruction are
not as effective. Crypto-shredding is a newer technique where all the cryptographic keys used for decrypting
the data are destroyed. This makes the data undecipherable and prevents anyone from decrypting the data.
Additional measures you can take to further protect your data when using cloud applications:
1) Trusted platform module (TPM): a computer chip that can securely store passwords, certificates, and encryption keys.
2) Cloud hardware security module (CloudHSM): a computing device that provides secure storage for cryptographic keys and
processes cryptographic operations, such as encryption and decryption.
As more and more businesses move to the cloud, cloud security has never been a bigger priority, and it's important
to understand and configure everything properly, so that the cloud where you host your services and applications can remain a secure environment.