Microsoft Sentinel with Cloud-based (Azure) Honeypot lab

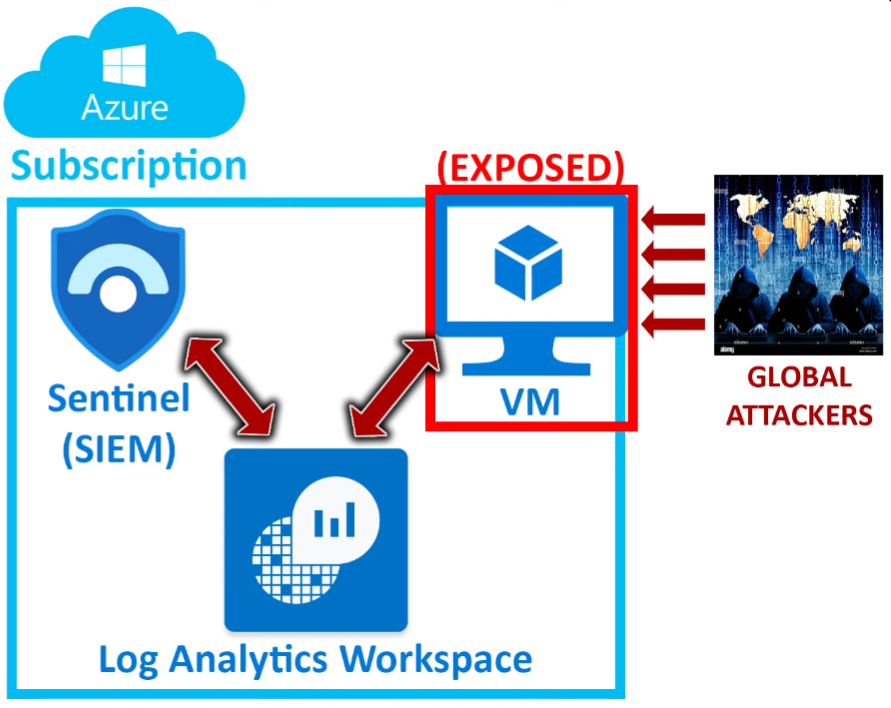
In this lab we're going to create a Virtual Machine in Azure, we then make it vulnerable on purpose so that it becomes
our Honeypot (it will be essentially exposed to attackers from all over the world), then we're going to
create a log repository using a tool in Azure called “Log Analytics workspace”, which will be used to store and classify the logs generated from
the Virtual Machine. Finally, still within Azure, we're going to set up Microsoft Sentinel,
which is a Security Information and Event Management (SIEM) system, and we're going to use it to analyse the data logs
and display on a world map all the attacks (RDP brute force attacks) happening towards our Honeypot Virtual Machine.
Here's a simple diagram showing an overview of this lab:
Tools used:
- Microsoft Azure Tools: Virtual Machine, Logs Analytics Workspace, Microsoft Sentinel
- Windows 10 Pro Machine
- Powershell and KQL scripts
Getting started:
*Important Disclaimer: keep in mind that Microsoft has a tendency to often change menus, names of certain
settings etc. when upgrading Tools and Systems inside Azure. The date of when I'm writing this and doing this lab is September 2023, if you
can't find certain settings or the name doesn't correspond to what you see here, it probably means that Microsoft has changed those names/settings.
This doesn't mean that you won't have what you need to perform this lab, it simply means that you need to
search for the new name of the setting or service that's been updated or replaced.
Back to our lab. What we want to do first is to set up our Azure account: you can create one for free with a $200 credit,
you can use that credit for a month and most Azure services will be available.
This lab will use barely any of that $200 credit, however just make sure to delete all the resources after you're done
with it, otherwise you might end up paying for them!
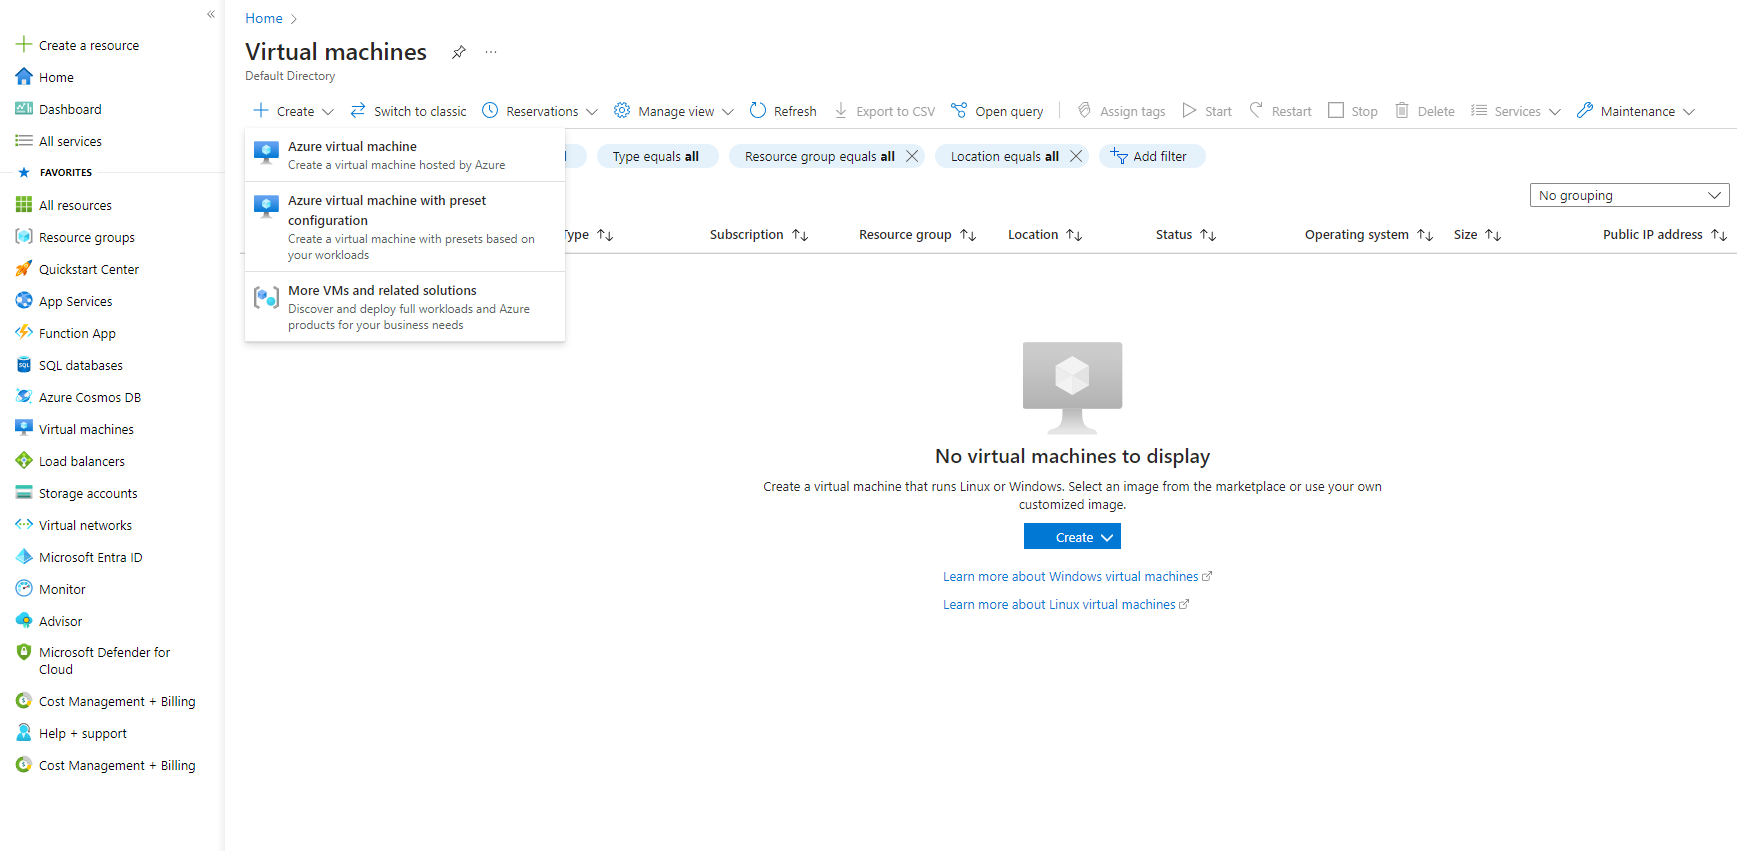
Once you have your subscription and account created, go to portal.azure.com to enter your Azure portal, type in the
search bar at the top (or select the corresponding icon) “Virtual Machine”, and then create a new Virtual Machine.
Here you want to choose a name for your “resource group”, which is the group where we're going to keep all our
resources for this lab, you can think of it as a folder for all the resources you're going to use. I decided to call it “labsentinel” but you
can choose whatever name you prefer.
Now type in a name for the Virtual Machine, again, choose whatever name you like, I called mine “honeypotVM”, select
Windows 10 Pro for the Image, and leave every other option as-is. (The region pick the one that's closest to where you are located)
Next you want to type a username and a password, just make sure you remember them because we're going to use them to log in;
I've used “labadmin” as username. Check the box at the bottom and then click next to proceed.
Once you get to the Networking section, at the NIC network security group tab,
select “Advanced > create new”, you can think of this as our own custom firewall, we're going to make it open and vulnerable
to essentially anything on the internet. (obviously, you should never do this on a real machine)
Here you want to remove the default inbound rule, and select “add an inbound rule”, then on the screen that appears on the right
you want to put the following settings:
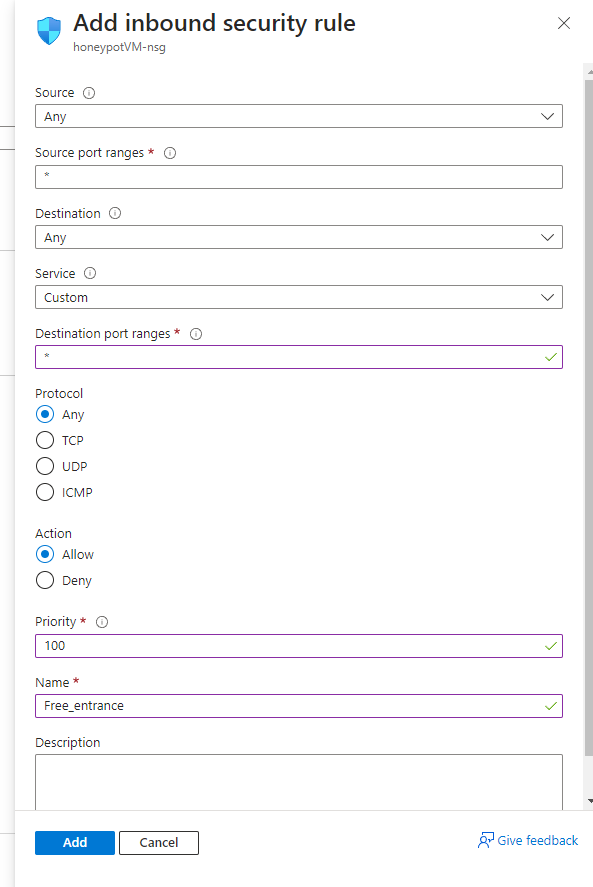
The point of this is to make our Virtual Machine very discoverable and vulnerable, to act as our Honeypot.
Now Click on “review + create” at the bottom, and finally “create”.
The deployment process might take a while, in the meantime go to the search bar at the top and type “Log Analytics workspace”.
Click on create, select the resource group we named before and go ahead with the “review + create” to finish the process.
We're going to use this log workspace to obtain and store the Windows Event logs from our Virtual Machine, and also custom logs that we will set up and that
will show us the geographical location from where the attacks are coming from.
Next go to the search bar at the top and type “Security”, here we're gonna enable the ability to gather logs
from the Virtual Machine and have them in the Log Analytic workspace. Go to “Microsoft Defender for the Cloud” and then select
“Environment Settings”, here select the Log Analytics workspace you just deployed after clicking on expand all.
(it can be difficult to find)
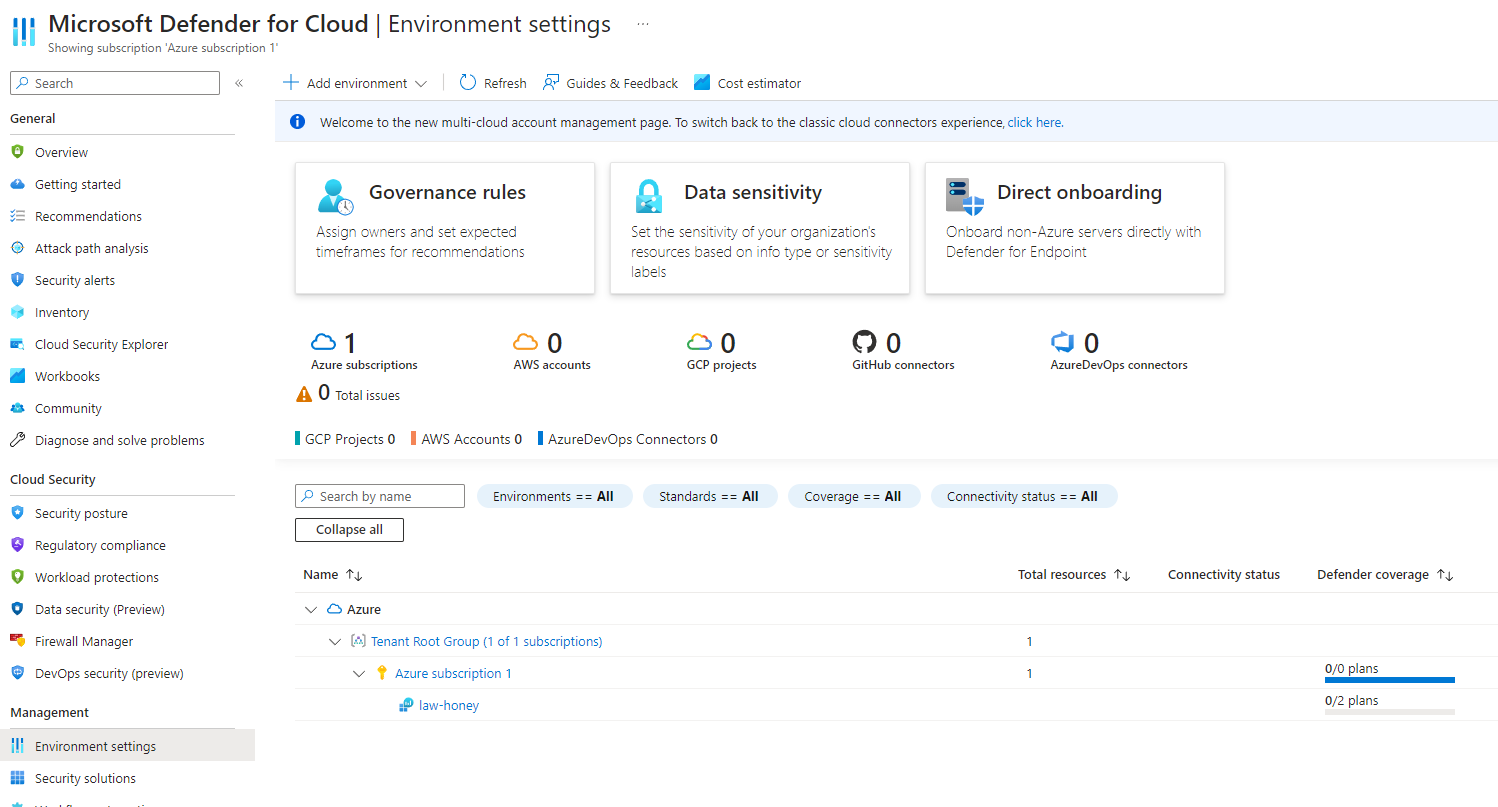
At this point you want to turn on “Foundational CSPM” and “Server” and click Save. Then on the left, on the
“Data collection” tab, click on “All Events”, to allow us to gather all the logs we need. Click on Save and finish this process.
Now go to the Log Analytic workspace, select it and then select Virtual Machines on the left panel, then click
on “connect” at the top. We should now have our Virtual Machine connected to our Log Analytic workspace.
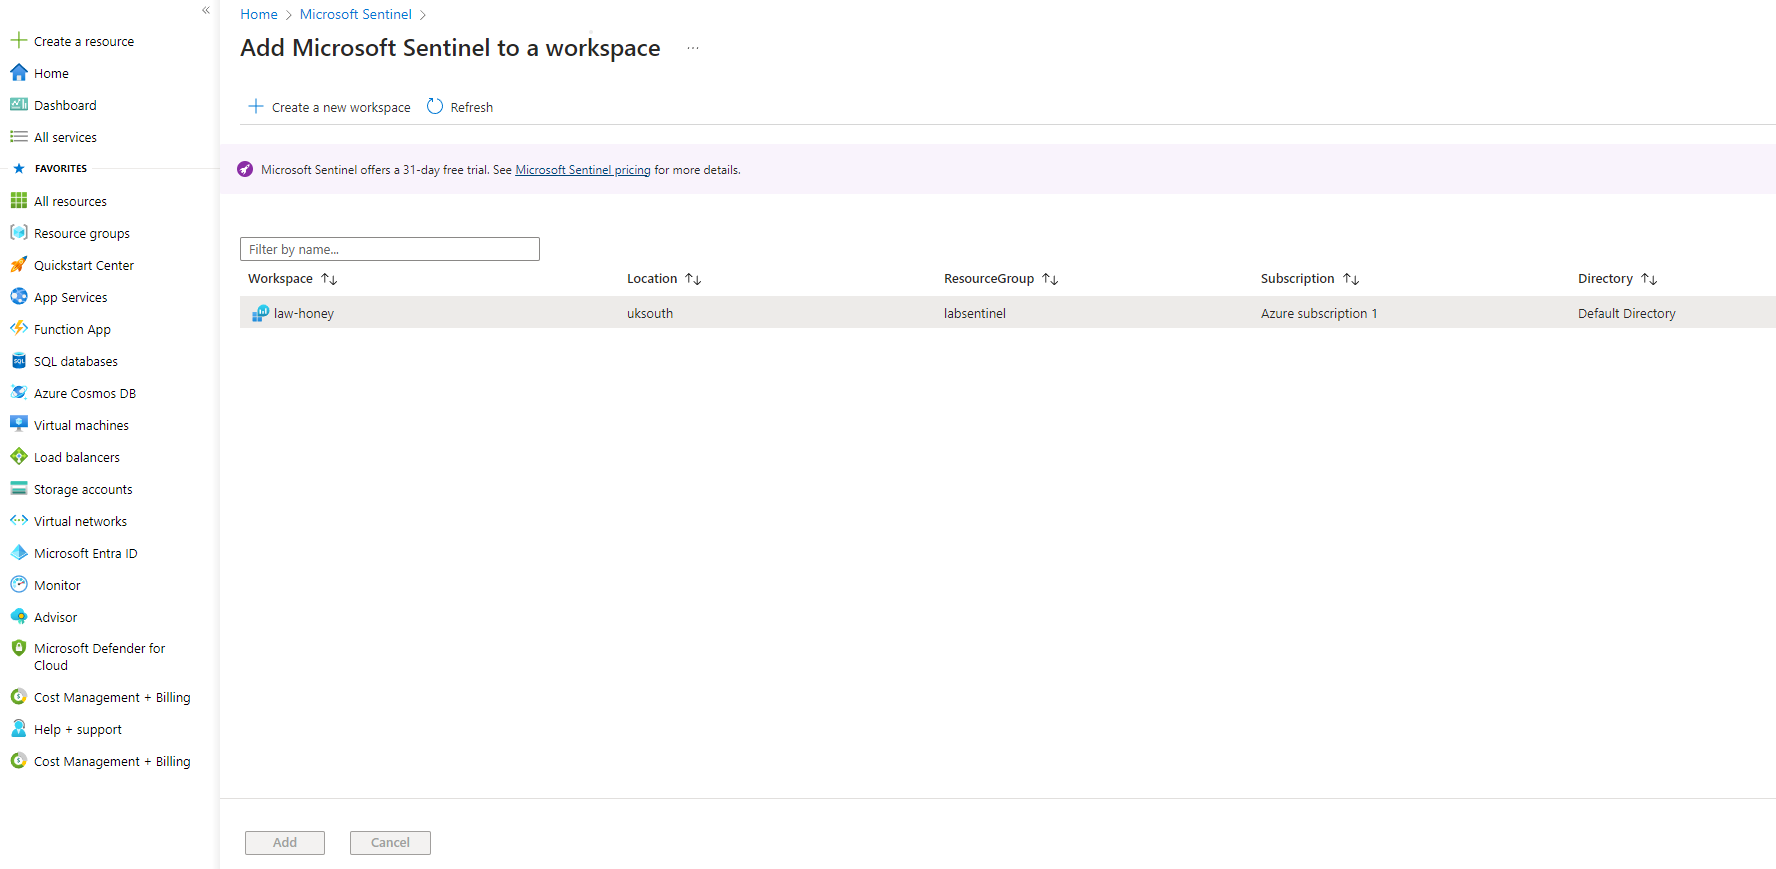
Now we're going to quickly set up Microsoft Sentinel, simply search for it in the search bar at the top and then,
once inside the Sentinel dashboard, select “create”. Here pick the Log Analytic Workspace and click on Add.
Once that's done, go to the Virtual Machine we created earlier.
Copy the public IP address you see here, then go to your computer (outside of Azure) and open Remote Desktop,
paste the IP address and you can now remotely connect to our Virtual Machine after also typing in the credentials
(username and password) that we set earlier. You can also connect to our Virtual Machine in a few other ways, simply select
"connect" at the top of your Virtual Machine dashboard in Azure, and then pick your preferred method; by selecting RDP you
will download a file that will essentially replicate what we just did to manually connect.
Now that we're inside our Virtual Machine, go ahead and set up Microsoft Edge as we will use it later on, then open the
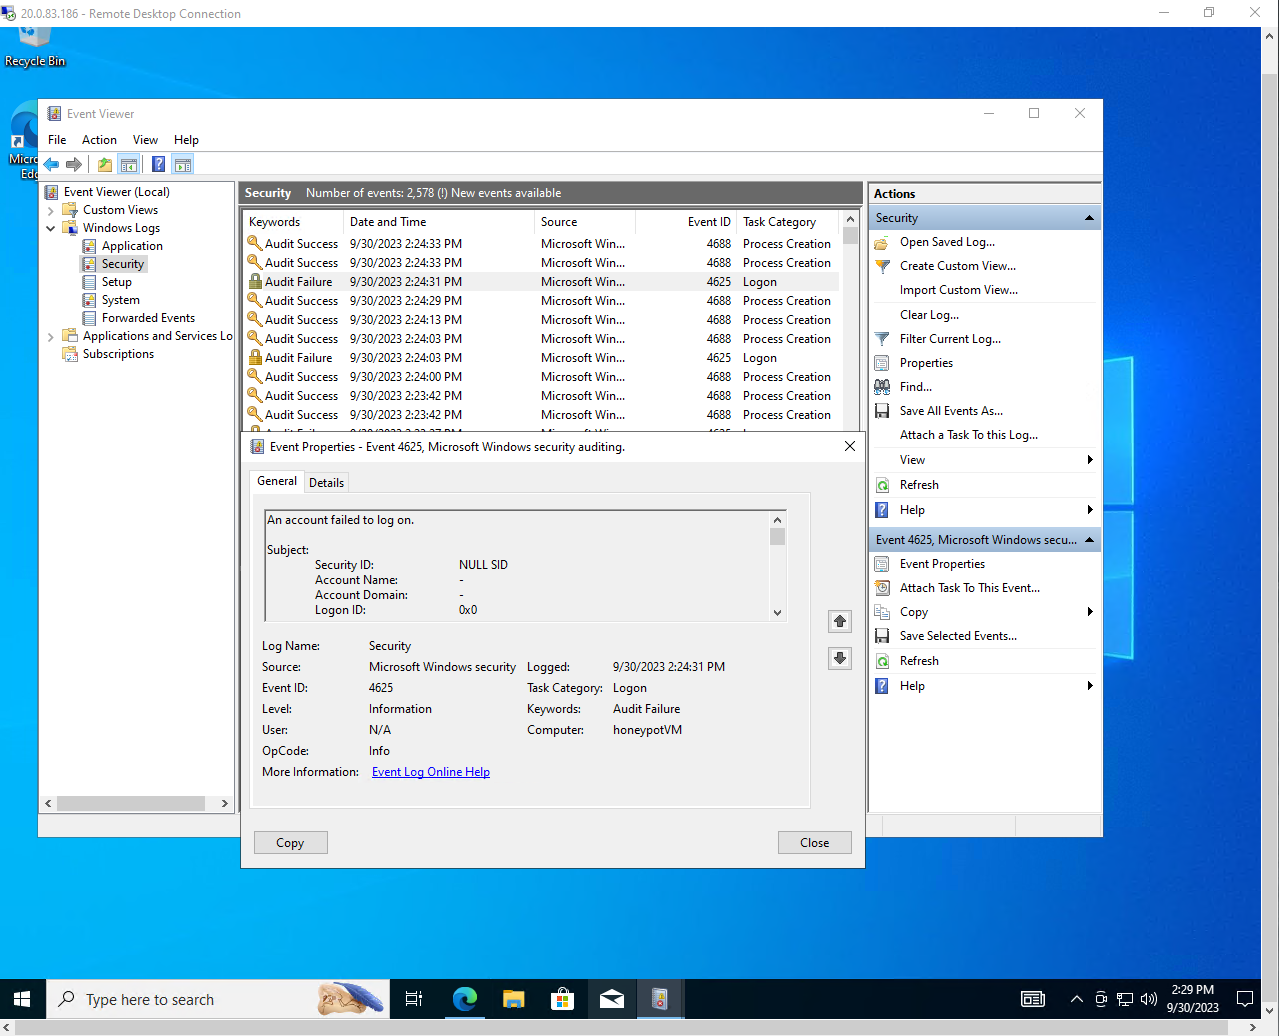
Event Viewer. Here go to “Windows logs > Security”, we can see all the security events related to our Virtual Machine,
in particular we're going to be interested in the event ID 4625, “Audit failure”, we'll be gathering these
security event logs because they will show all the failed attempts to log in our Virtual Machine, while also showing
the IP address of who tried to log in. (so we will know their location)
At this point, if you go to your command prompt and try to ping the Virtual Machine, you will see that it won't work and the
request is timed out. We could just enable ICMP but since this is our Honeypot, we're simply going to disable
the Microsoft Defender Firewall. Search for “wf.msc” to quick-access it, then go to properties and turn OFF the Domain Profile,
Private Profile and Public Profile. Now if you try to ping your VM again you will see that the ping goes through.
Open your browser in your VM and go to this GitHub page: Microsoft Sentinel Azure lab,
to download the Powershell script called Logs_Transfer.ps1, this
will allow us to later get the location of where all the IP addresses that are attacking our Honeypot are coming from. Alternatively, you can copy-paste
the code of that script in a new file that you create with Powershell, remember to do this in your Virtual Machine and not on your actual PC.
From that same GitHub page downalod the file called KQL_scripts.txt as well, which we will use later on.
To use the Logs_Transfer.ps1 script, you need to go to this website: ipgeolocation.io
and sign up (it's free and super simple to register a new account), once you do,
it will give you an API_KEY which you need to paste in the code inside the script, right at the top.
The Powershell script extracts logs from the Event Viewer, specifically logs related to failed login attempts, and then it uses the ipgeolocation.io website to determine the geographical
location of the attacks (RDP brute force attacks). The script will generate logs with that information, and they will be stored
in a log file in C:\ProgramData.
By running the script, you should see something like this:
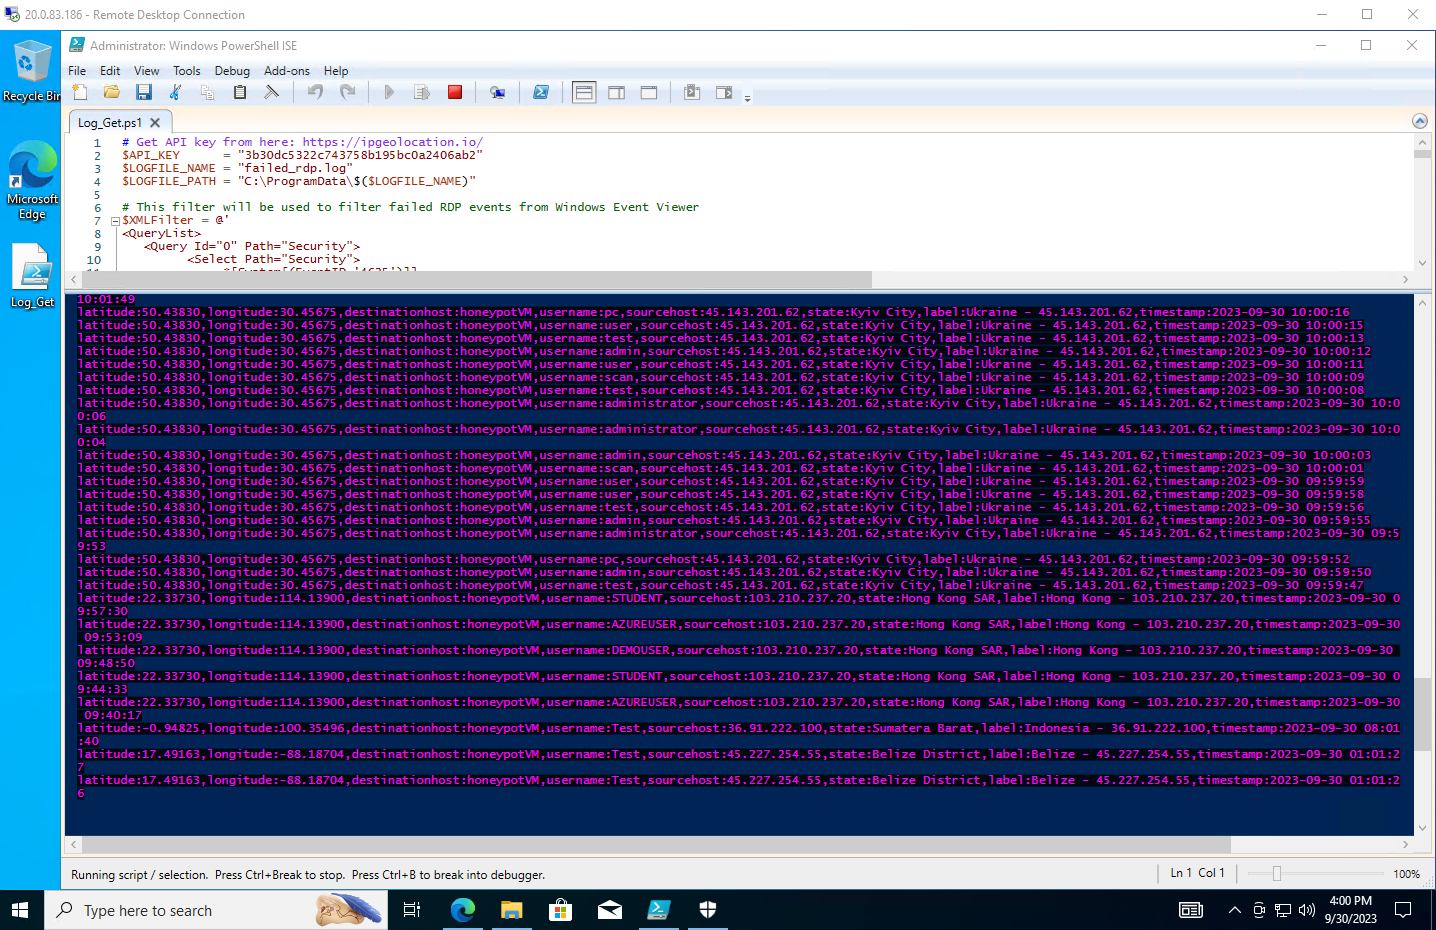
The script is also using some sample data, and you can see all this data in the failed_rdp file it generated in C:\ProgramData.
As you can tell from the screenshot, people already tried to log in our machine, even though we made it vulnerable just a few moments ago! Wild.
Working with Logs Analytics workspace:
Going back to Azure, we're going to allow Log Analytics workspace to import custom logs, that is our logs with
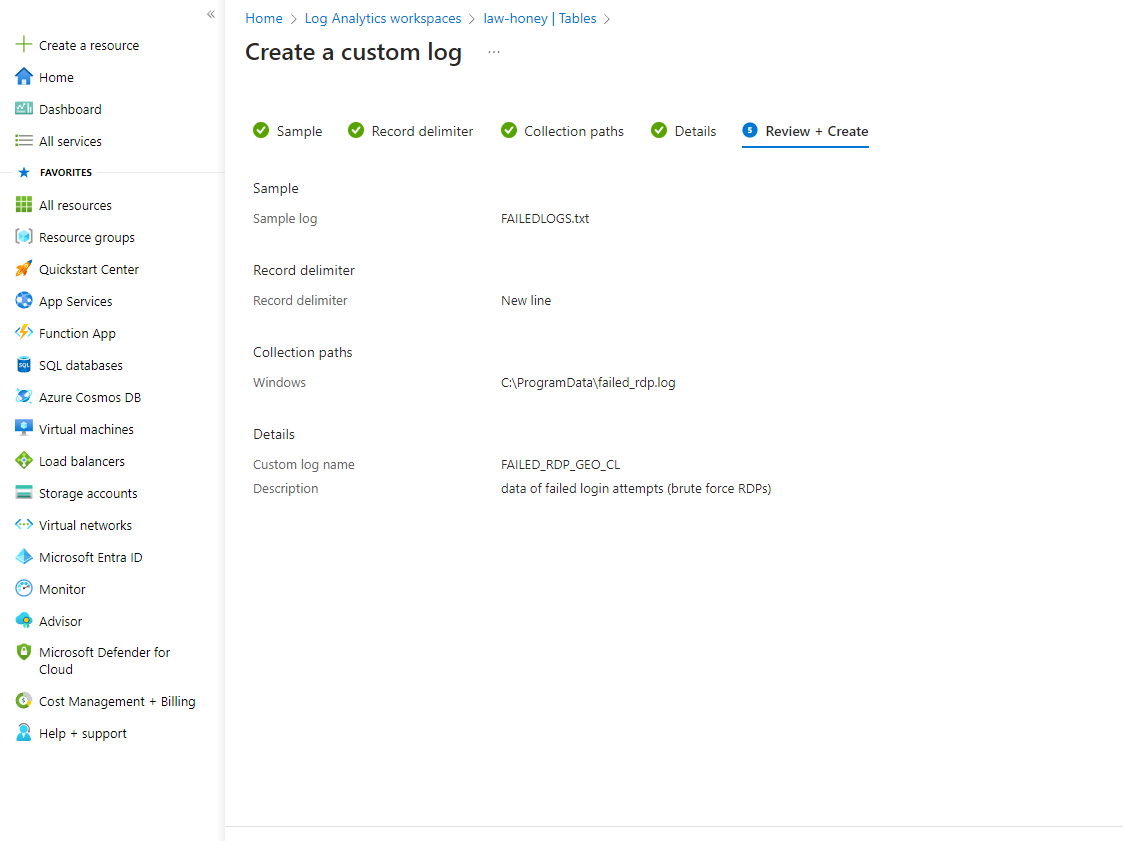
geographical data in it. Select the workspace and then select “Tables > Create > New Custom Log (MMA-Based)”,
here we have to upload/select the failed_rdp file we generated earlier to create the custom log, however that file is in our
Virtual Machine, so simply go back to that file, copy the content, go back to YOUR machine and create a new txt file with
the content you just copied, then finally upload that file. It can get confusing, so double-check always to see if you're in your machine or in
the Virtual Machine, to avoid making mistakes.
Click Next and then on the Collection path, select Windows and type in the path where the log file is, C:\ProgramData\failed_rdp.log, choose a name for
the custom log and click on Create at the bottom to finish the process.
You should now be able to see your custom log in your “Logs” section of the workspace by simply typing the name you
chose for it in the query command line at the top, and then running the process. What we can do next is extract the raw data you see from the logs
and obtain custom fields like the Country field or the Latitude field, so we can take a look at a more organized data.
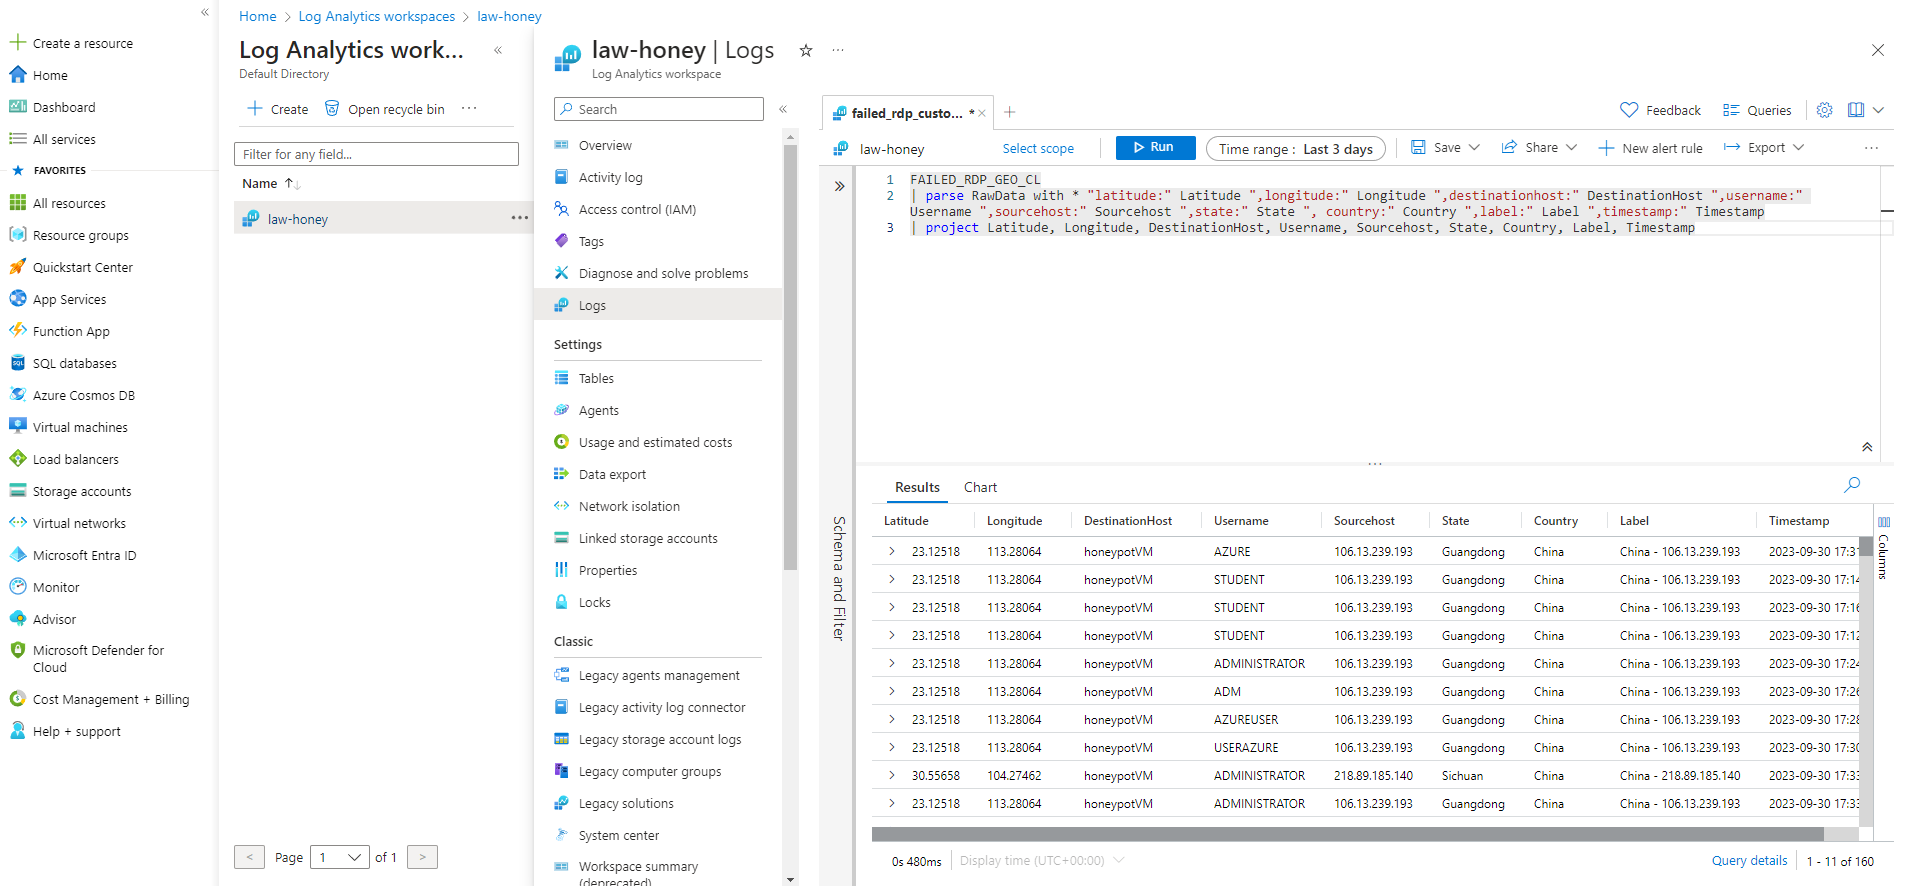
To do this, simply paste the first script in the KQL_scripts.txt file you downloaded earlier, which is written in KQL (Kusto Query Language),
in the query command line. (replace FAILED_RDP_GEO_CL with whatever name your custom log has).
For reference, this is the script:
										FAILED_RDP_GEO_CL

										| parse RawData with * "latitude:" Latitude ",longitude:" Longitude ",destinationhost:" DestinationHost ",username:" Username ",
										  sourcehost:" Sourcehost ",state:" State ", country:" Country ",label:" Label ",timestamp:" Timestamp

										| project Latitude, Longitude, DestinationHost, Username, Sourcehost, State, Country, Label, Timestamp
Once you run that you should see your log data organized by field. You can also save this query so you don't need
to paste that code again every time you want to use it.
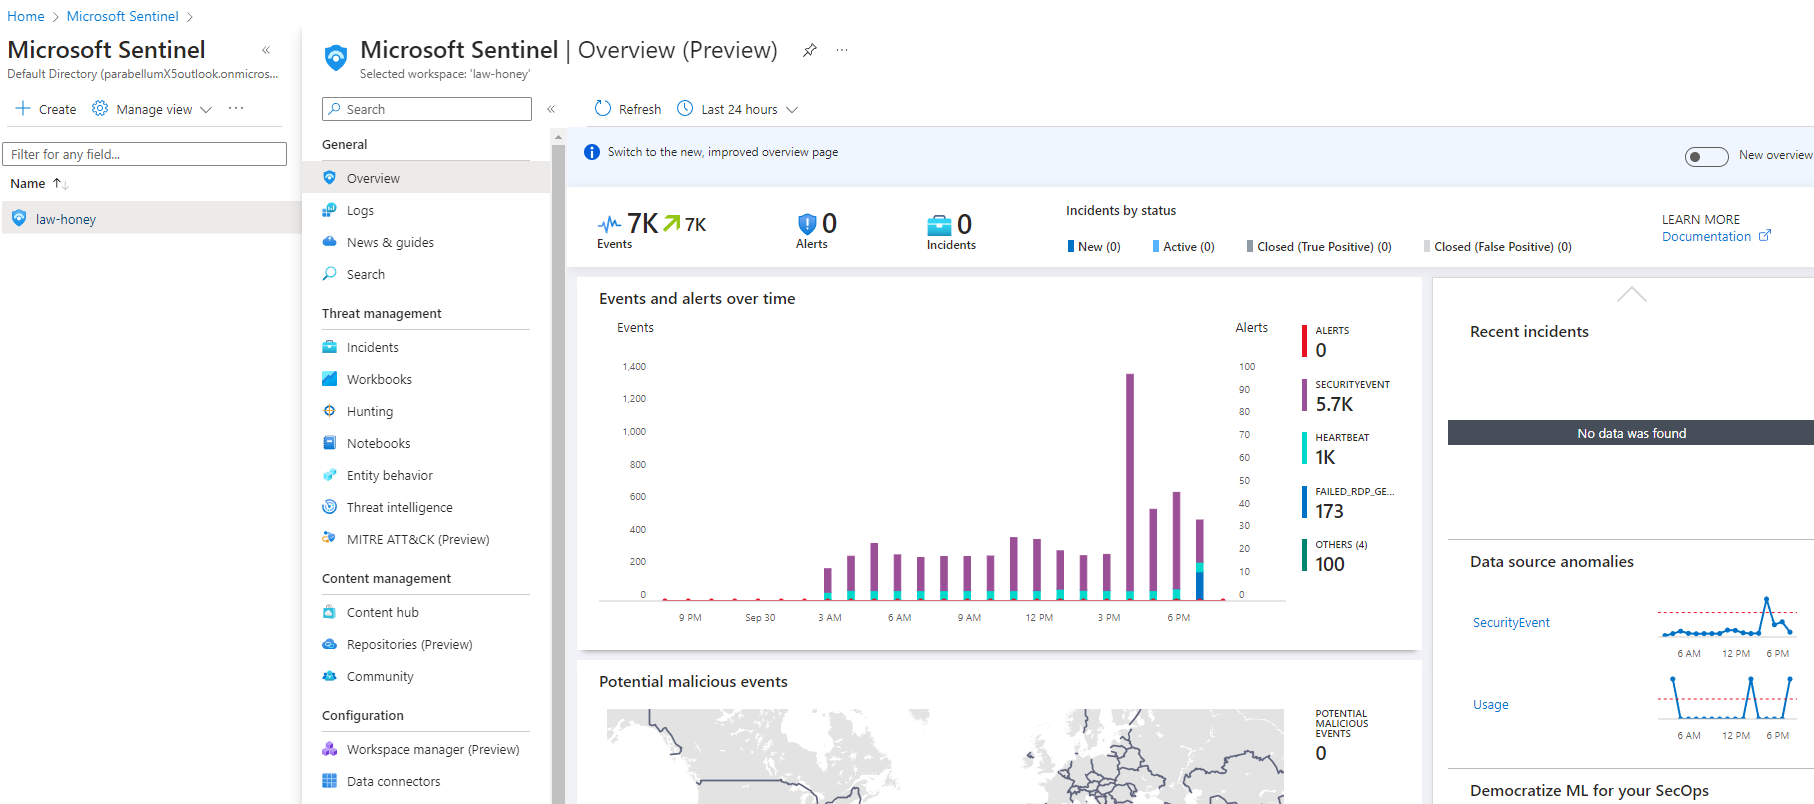
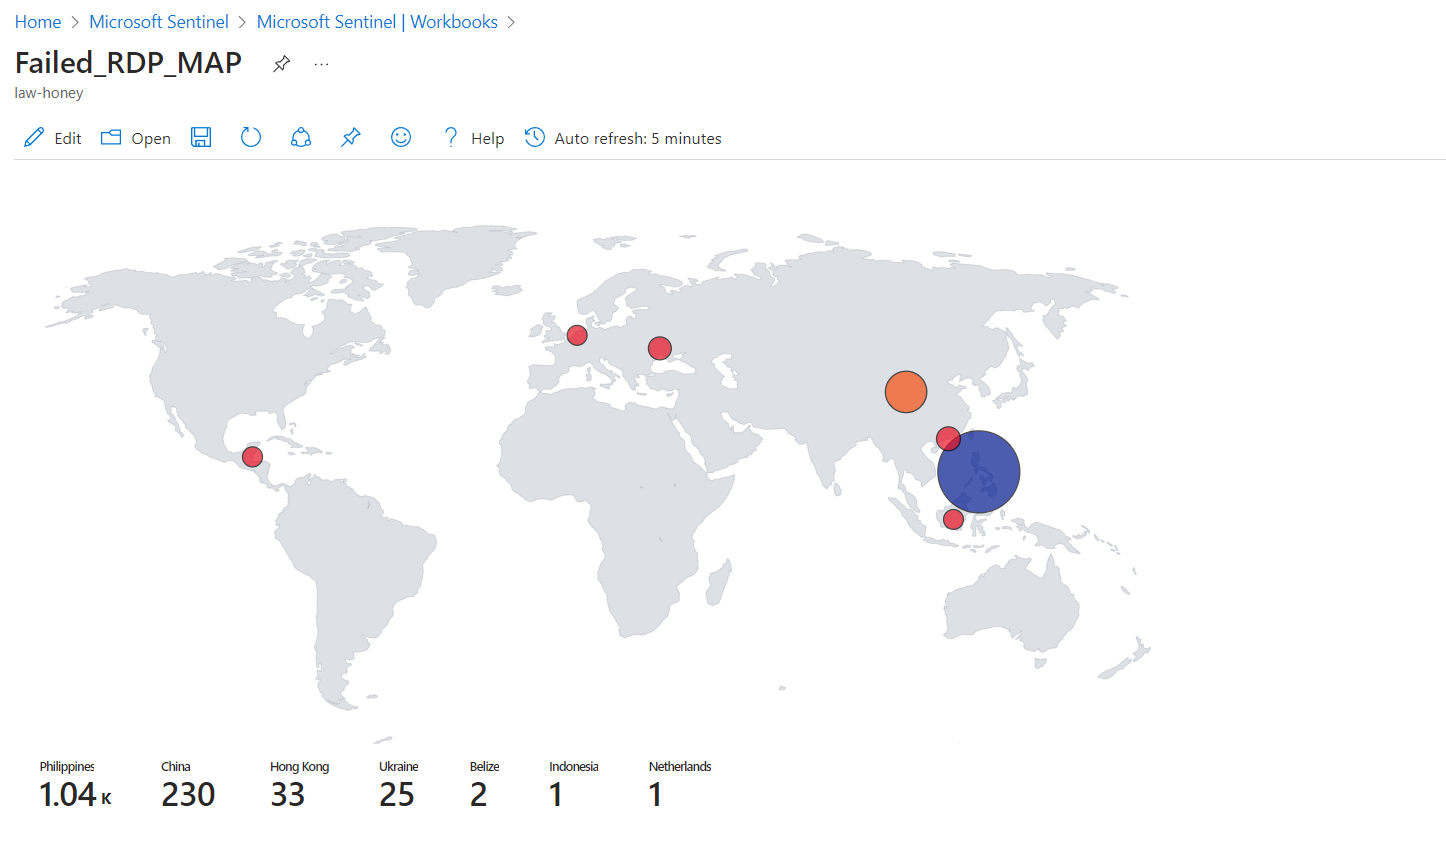
Microsoft Sentinel Visual Map:
We're now going to use Microsoft Sentinel to set up our World Map, where we will display all the attacks and where
they are coming from. Once you're in Sentinel and you have selected the workspace we connected earlier, you should already
see a diagram with events and alerts.
Click on Workbooks on the left panel and then “Add workbook”, then click on edit and remove those 2
widgets you see by default. Then click on Add query and paste the second script you see in the KQL_scripts.txt file.
For reference, this is the code:
									FAILED_RDP_GEO_CL

									 | extend username = extract(@"username:([^,]+)", 1, RawData),

    							     timestamp = extract(@"timestamp:([^,]+)", 1, RawData),

       								 latitude = extract(@"latitude:([^,]+)", 1, RawData),

     							 	 longitude = extract(@"longitude:([^,]+)", 1, RawData),

       								 sourcehost = extract(@"sourcehost:([^,]+)", 1, RawData),

      							     state = extract(@"state:([^,]+)", 1, RawData),

      								 label = extract(@"label:([^,]+)", 1, RawData),

     	 							 destination = extract(@"destinationhost:([^,]+)", 1, RawData),

     								 country = extract(@"country:([^,]+)", 1, RawData)

									 | where destination != "samplehost"

									 | where sourcehost != ""

									 | summarize event_count=count() by latitude, longitude, sourcehost, label, destination, country
Run the query and then select at the top “Visualization > Map”, a world map should appear and you should see
where the attacks (that is, the failed login attempts / failed brute force RDP attempts) are coming from. Select the auto-refresh option and set it
to 5 minutes, then save your query at the top, select “Done editing” and you should now only see your world map,
with live attacks happening!
Keep in mind that for receiving logs and for the attacks to show on your map, you need the Virtual Machine and the Powershell script running,
otherwise Microsoft Sentinel won't be receiving any data.
Conclusions:
As you could see from this lab, as soon as anything gets on the internet and it's without standard protections and it's just
out there, discoverable by anyone, people (or more likely bots scouting the web, or both) will definitely try to get into it,
and it won't take a lot of time and effort for them to try.
This lab is also showing how crucial it is to have a really strong password, multi-factor authentication methods
and any other tool that keeps you protected, because security is always and always will be an extremely
important factor in anything we do with technologies.